The Profitability Illusion: Why Record Production Doesn’t Mean Record Income
A bumper crop feels like a win until the numbers come in. Production and profit are different measures, and the gap between them is where many farms struggle.
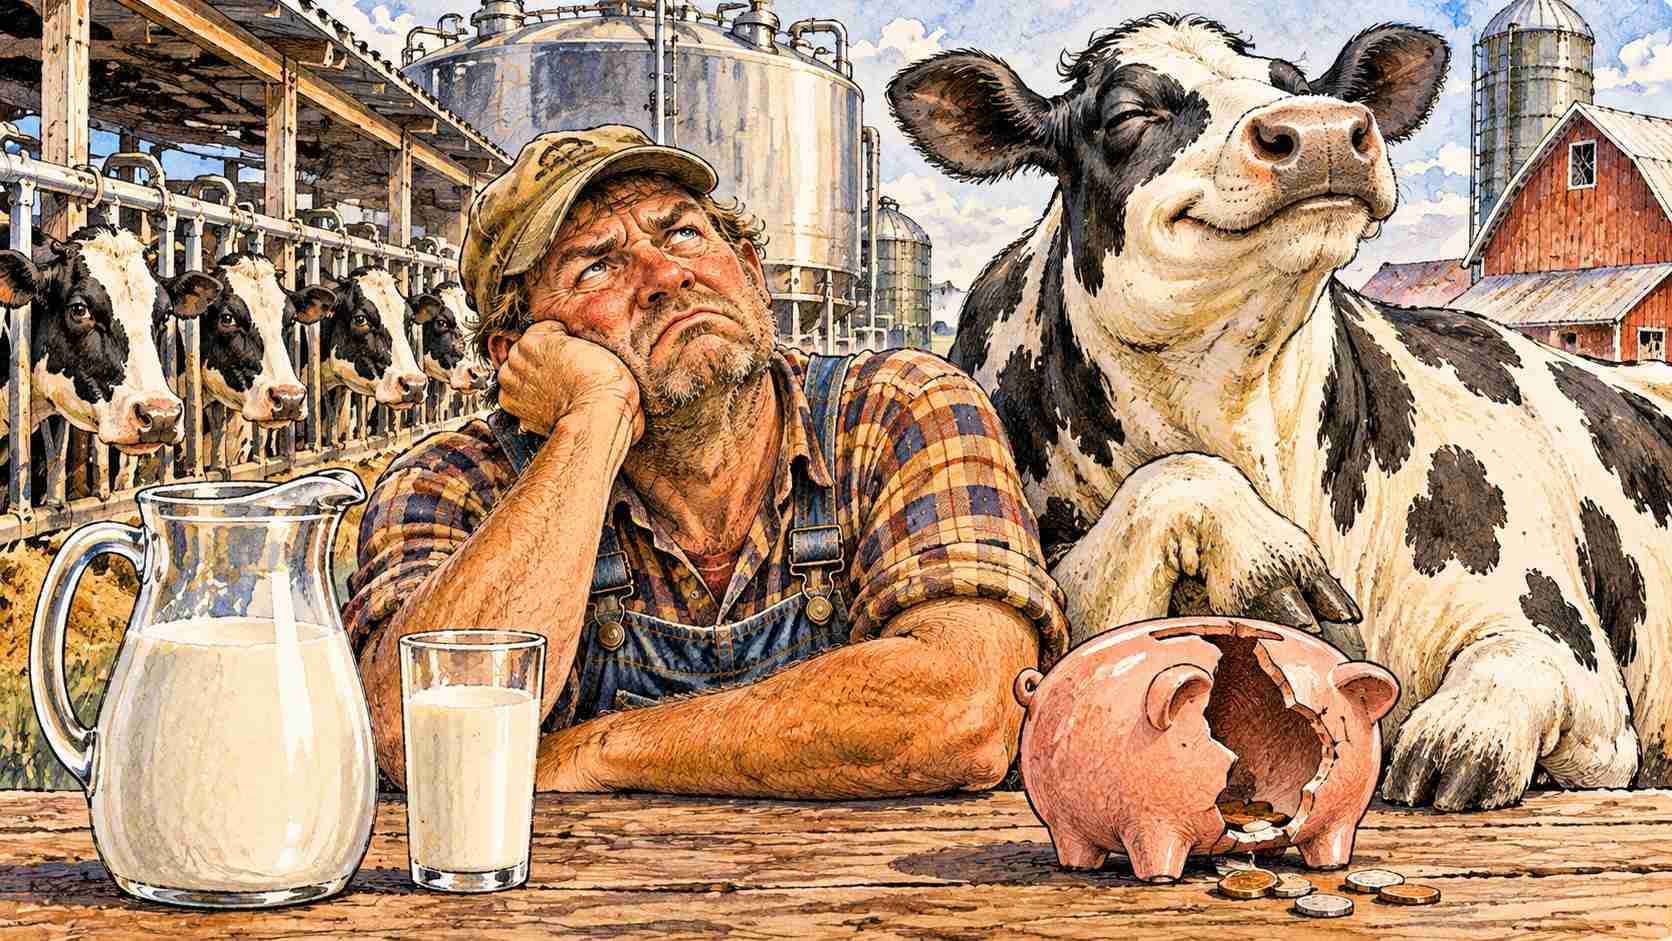
Why can record production still lose money?
Production counts bushels or pounds. Income counts what is left after every cost. If a large crop pushes prices down, or if inputs cost more than they did, the extra volume can fail to cover the extra expense. Revenue per acre can rise while profit per acre falls.
The headline claim of record production should be checked at USDA NASS for the crop and year in question. Then compare it with price and cost data from USDA ERS to see the other side of the ledger.
Cash matters as much as profit. A farm can show a profit on paper and still run short of cash if the crop is stored, if bills are due before sale or if debt payments are large. Track both an income statement and a cash flow statement so you see each one clearly.
What are the pieces of the margin?
Think of margin as price times yield minus costs. Price depends on markets and basis. Yield depends on weather and management. Costs include seed, fertilizer, chemicals, fuel, labor, repairs, rent and interest. A move in any piece changes the result, and the pieces often move in opposite directions.
Supply matters too. When many farms have a good year at once, the extra supply can weigh on prices. That is the classic reason a good crop for the country can be a hard year for the individual farm.
The Kansas City Fed reports on farm income and credit conditions in this region and is a helpful reality check on how the pieces are moving across the Tenth District, which covers part of Oklahoma. Pair that with your own records and your local elevator's basis history.
- Price received, after basis
- Yield per acre
- Total cost per acre, including rent and interest
How do you measure your own profitability?
Use cost of production by enterprise. Divide your total costs by your bushels or pounds to get a break-even price, then compare it with what you can actually sell for. Include a wage for your labor, even if you do not pay yourself one, so you can see the true economics.
OSU Extension publishes crop budgets and farm management tools for Oklahoma, and farmdoc daily explains the economics of crop returns in detail. Use them as templates, then swap in your own numbers.
Do not forget land costs. Cash rent and land payments are often the largest single line, and they rarely drop as quickly as prices do. When margins are thin, a candid conversation with a landlord about rent, flexible terms or crop share can change the picture more than any input trimming.
What does it mean for wheat and cattle in northwest Oklahoma?
Wheat can have a high yield year with a low price, and cattle producers can see strong calf prices wiped out by feed and replacement costs. The combination of weather, markets and costs is different on every operation, so avoid copying a neighbor's plan without checking your own numbers.
The crop calendar guide helps with timing field work and inputs, and the ranch beef cattle guide covers herd economics. Both are general education to pair with your own records.
If you run both crops and cattle, track them separately. A strong enterprise can hide a weak one, and you will not see the problem unless you divide the costs. Even a simple spreadsheet with a column per enterprise will do the job.
Is the illusion real? Two views
Supporters of the illusion argument say headline production numbers and even gross income figures mask rising costs, debt and thin margins, and that policy should look at net returns rather than volume.
Skeptics respond that production growth reflects real productivity gains, that long-run farm income has been healthy in many periods and that low prices and high costs are part of normal cycles. Look at several years of net returns, not one season.
The disagreement here is partly about which numbers matter. Gross revenue, net farm income and return on assets each tell a different story, and a person arguing for one can ignore the others. Ask which measure is being used before you accept a conclusion.
Turning the idea into a plan
Run three scenarios each year: expected, low and high prices. Know the price at which you lose money, and decide ahead of time how you would respond. Talk to your lender before planting, not after harvest. Crop insurance and marketing plans protect the downside.
For more reading, farm.FM covers farm economics at its agribusiness desk and the lighter side at the satire section, including a farm.FM piece on record crops and low prices. Check every figure at its original source.
If numbers are uncomfortable, that is normal. Getting them on paper is the first step to better decisions, and an hour with a farm management specialist can save a season of guessing.
Sources and further reading
- USDA NASS: agricultural statistics and surveys
- USDA Economic Research Service: farm economy data and analysis
- OSU Extension: Oklahoma State extension
- farmdoc daily: University of Illinois farm economics
- USDA Risk Management Agency: crop insurance
- Kansas City Fed Agriculture: farm credit and land value surveys
Ask locally: Ask an OSU Extension farm management specialist, your lender or your accountant to help build a cost-of-production budget.